 |
||
| WideStudio Application Builder User's Guide | ||
|---|---|---|
Trace DebuggerHow to use the trace debuggerUse the trace debugger to see the execution status of the event procedures executed. Fist of all, build the application, and select ((menu:Build >> Trace Execution)), then the trace dialog appears as follows: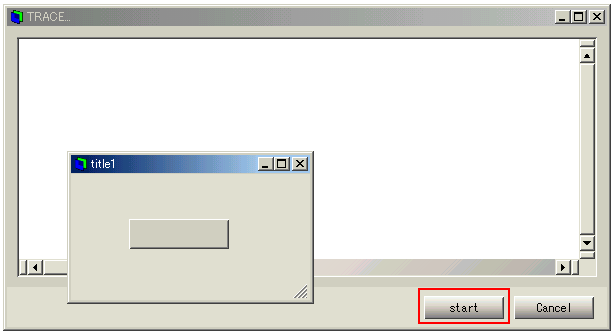 [Trace Dialog] 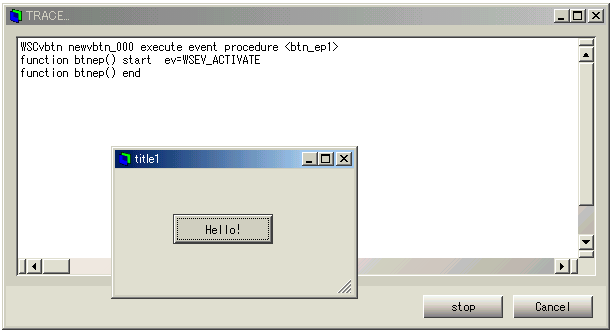 [Trace output] function functionname( ) endwhere "functionname" is the name of the function of the event procedure. Further more, you can show a trace message from your application using WSGFtrace() function as follows (A):
#include <WScom.h>
#include <WSCfunctionList.h>
#include <WSCbase.h>
//-----------------------------------------------
//Function for the event procedure
//-----------------------------------------------
void btn_ep1(WSCbase* object){

  object->setProperty(WSNlabelString,"Hello!");
  WSCstring string;
  string = "btn_ep1 called!!!!!\n";
  WSGFtrace(string);                            //(A)
}
static WSCfunctionRegister  op("btn_ep1",(void*)btn_ep1);
Note that the output by WSGFtrace() is enabled only when the tracing
is turned on.
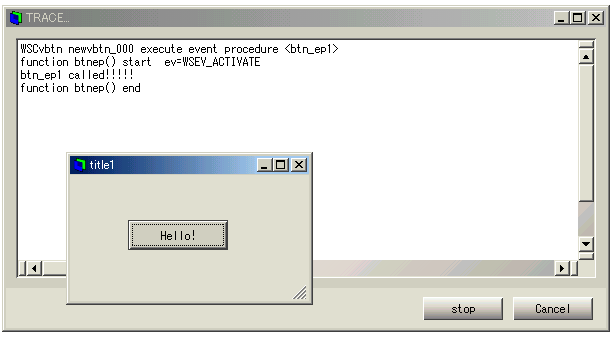 [Trace output by the application]
|
||
 |
| Please feel free to contact us for any questions/bugs after checking the mailing list |
|
Copyright©WideStudio Development Team,1999-2005
|