WideStudio Application Builder User's Guide

How to Debug an Application

To build an application with debugging mode, select ((menu:Build >> Debug)).
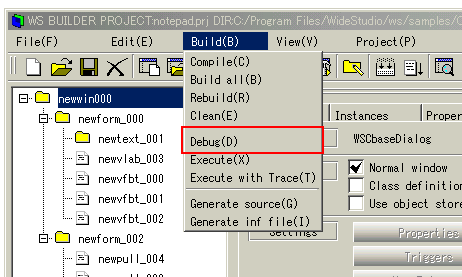


[Start the debugger]

Usage of GDB

Enter "run" to execute an application. Enter "where" to stack trace when the program is stopped by error. Enter "list" to see the position of the source.

There are the following commands in GDB.


  • Run

    Run command starts the application.

  • Cont

    Cont command continues the interrupted application.

  • Step/next

    Step / next command runs the interrupted application step by step.

  • Where

    Where command Shows stack trace of function call.

  • print

    Print command shows the value of variables or functions.

  • list

    List command shows the current position of source.

  • break

    Break command adds a break point. Enter it as follows.

    Break file.cpp:XXX

    Break CLASS: FUNCTION ()

    XXX is a line number.

  • cntl-C

    Cntl-C interrupts the application.


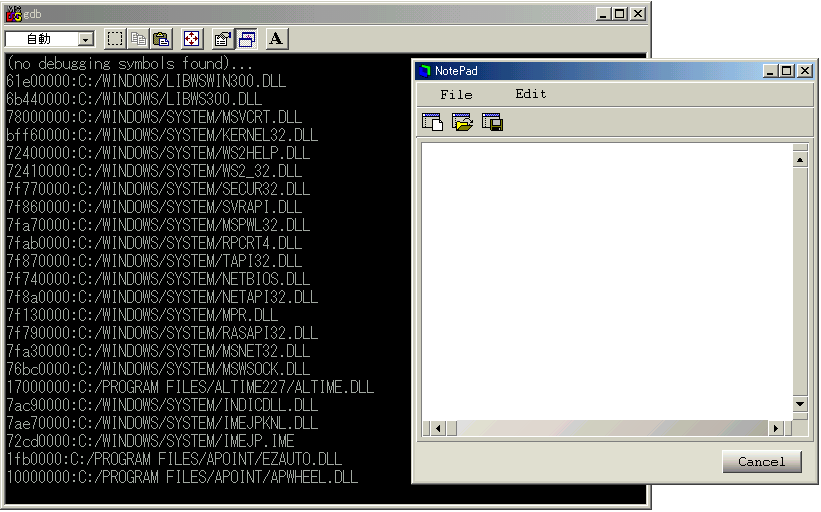
[Debugging the application]


WideStudio documents index | Table of contents
Please feel free to contact us for any questions/bugs after checking the mailing list
Copyright©WideStudio Development Team,1999-2005